Allot NetEnforcer Cacti Graphs
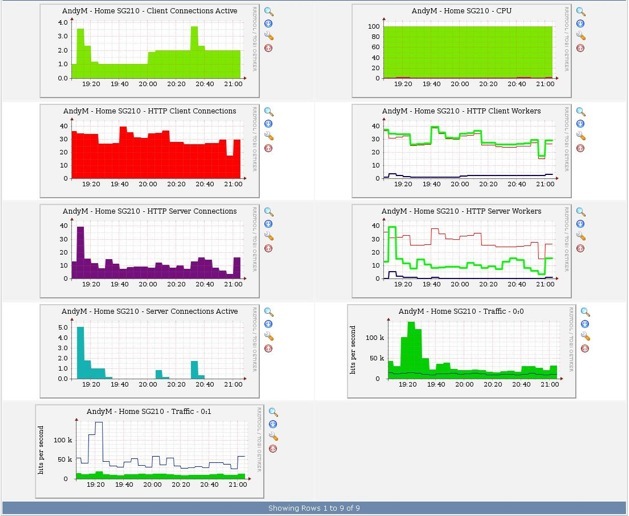
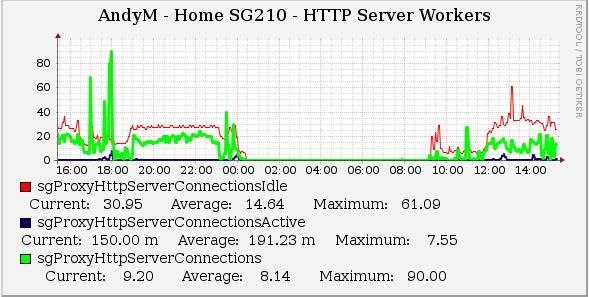
I’ve been using an internally written Cacti host template to graph CPU, Memory and Storage statistics for the excellent Allot NetEnforcer (AOS platform) on our AC1400 appliance for a while now, and as they’ve seemed to be OK, I’m posting them here for anyone who’s interested.

The interface statistics are taking off of the built-in IF-MIB table which the NE will respond on. The CPU/Memory/Storage are from the ALLOT-MIB.
ALLOT-MIB::alSensorType.0.2001 = INTEGER: fan(2)
ALLOT-MIB::alSensorType.0.2002 = INTEGER: fan(2)
ALLOT-MIB::alSensorType.0.2003 = INTEGER: fan(2)
ALLOT-MIB::alSensorType.0.2004 = INTEGER: fan(2)
ALLOT-MIB::alSensorType.0.3001 = INTEGER: powerSupply(3)
ALLOT-MIB::alSensorType.0.3002 = INTEGER: powerSupply(3)
ALLOT-MIB::alSensorType.0.10001 = INTEGER: cer(10)
ALLOT-MIB::alSensorType.0.11001 = INTEGER: noc(11)
ALLOT-MIB::alSensorType.0.12001 = INTEGER: activeLines(12)
ALLOT-MIB::alSensorType.0.13001 = INTEGER: activePipes(13)
ALLOT-MIB::alSensorType.0.14001 = INTEGER: activeVcs(14)
ALLOT-MIB::alSensorType.0.15001 = INTEGER: registerSubscr(15)
ALLOT-MIB::alSensorType.1.1001 = INTEGER: temperature(1)
ALLOT-MIB::alSensorType.1.1002 = INTEGER: temperature(1)
ALLOT-MIB::alSensorType.1.4001 = INTEGER: cpu(4)
ALLOT-MIB::alSensorType.1.5001 = INTEGER: memory(5)
ALLOT-MIB::alSensorType.1.6001 = INTEGER: storage(6)
ALLOT-MIB::alSensorType.1.10001 = INTEGER: cer(10)
ALLOT-MIB::alSensorType.1.11001 = INTEGER: noc(11)
ALLOT-MIB::alSensorType.1.12001 = INTEGER: activeLines(12)
ALLOT-MIB::alSensorType.1.13001 = INTEGER: activePipes(13)
ALLOT-MIB::alSensorType.1.14001 = INTEGER: activeVcs(14)
ALLOT-MIB::alSensorRawValue.0.2001 = INTEGER: 2
ALLOT-MIB::alSensorRawValue.0.2002 = INTEGER: 2
ALLOT-MIB::alSensorRawValue.0.2003 = INTEGER: 2
ALLOT-MIB::alSensorRawValue.0.2004 = INTEGER: 2
ALLOT-MIB::alSensorRawValue.0.3001 = INTEGER: 0
ALLOT-MIB::alSensorRawValue.0.3002 = INTEGER: 7
ALLOT-MIB::alSensorRawValue.0.10001 = INTEGER: 7
ALLOT-MIB::alSensorRawValue.0.11001 = INTEGER: 344
ALLOT-MIB::alSensorRawValue.0.12001 = INTEGER: 1
ALLOT-MIB::alSensorRawValue.0.13001 = INTEGER: 8
ALLOT-MIB::alSensorRawValue.0.14001 = INTEGER: 12
ALLOT-MIB::alSensorRawValue.0.15001 = INTEGER: 0
ALLOT-MIB::alSensorRawValue.1.1001 = INTEGER: 24
ALLOT-MIB::alSensorRawValue.1.1002 = INTEGER: 31
ALLOT-MIB::alSensorRawValue.1.4001 = INTEGER: 5
ALLOT-MIB::alSensorRawValue.1.5001 = INTEGER: 61
ALLOT-MIB::alSensorRawValue.1.6001 = INTEGER: 71
ALLOT-MIB::alSensorRawValue.1.10001 = INTEGER: 7
ALLOT-MIB::alSensorRawValue.1.11001 = INTEGER: 344
ALLOT-MIB::alSensorRawValue.1.12001 = INTEGER: 1
ALLOT-MIB::alSensorRawValue.1.13001 = INTEGER: 8
ALLOT-MIB::alSensorRawValue.1.14001 = INTEGER: 12
The template can be downloaded from here