SGOS 5.x has some great added SNMP sub-tree bits which seems to correlate with MMC/Sky console information (but with added server connection information).
I’ve added some of our lab equipment to our resident Cacti server and so far the results are quite favorable.
Heres the information I used.
:: BLUECOAT-SG-PROXY-MIB ::
.1.3.6.1.4.1.3417.2.11.3.1.3 in English is the sgProxyHttpConnections table of BLUECOAT-SG-PROXY-MIB which gives:
sgProxyHttpClientConnections
sgProxyHttpClientConnectionsActive
sgProxyHttpClientConnectionsIdle
sgProxyHttpServerConnections
sgProxyHttpServerConnectionsActive
sgProxyHttpServerConnectionsIdle
Reading the subtree with command…
snmpwalk -v 2c -c <community> -m /usr/share/snmp/mibs/BLUECOAT-SG-PROXY-MIB.txt <ip> .1.3.6.1.4.1.3417.2.11.3.1.3
The following is returned…
BLUECOAT-SG-PROXY-MIB::sgProxyHttpClientConnections.0 = Gauge32: 31
BLUECOAT-SG-PROXY-MIB::sgProxyHttpClientConnectionsActive.0 = Gauge32: 1
BLUECOAT-SG-PROXY-MIB::sgProxyHttpClientConnectionsIdle.0 = Gauge32: 30
BLUECOAT-SG-PROXY-MIB::sgProxyHttpServerConnections.0 = Gauge32: 0
BLUECOAT-SG-PROXY-MIB::sgProxyHttpServerConnectionsActive.0 = Gauge32: 0
BLUECOAT-SG-PROXY-MIB::sgProxyHttpServerConnectionsIdle.0 = Gauge32: 0
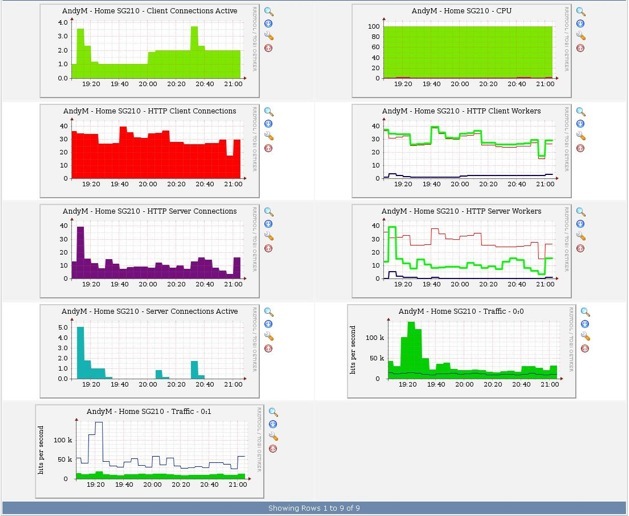
This is most useful as it will give good graphs to show the average load by client and server workers,
Here’s some output from Cacti which includes the addition of CPU idle/busy graphing also (OID .1.3.6.1.4.1.3417.2.11.2.1.7 sgProxyCpuBusyPerCent and .1.3.6.1.4.1.3417.2.11.2.1.8 sgProxyCpuIdlePerCent).
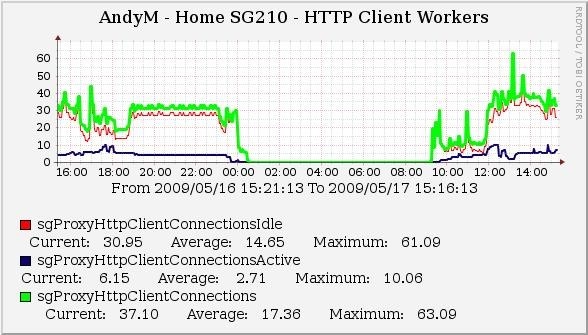
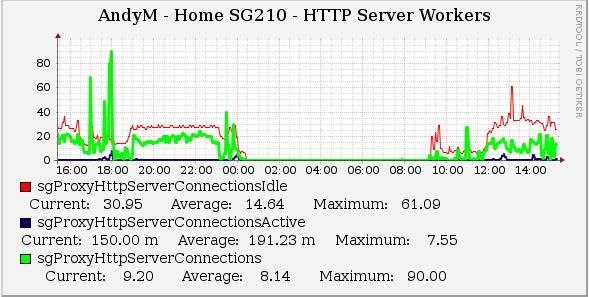
The Client and Server worker graphs deserve a closer look.
Here’s the exported cacti_host_template_proxysg.xml. When you import this template, check the ‘Use Custom RRD settings’ within Cacti.