So, it’s been a really long time since I last posted something here, and I wouldn’t want the internet to think I’ve been doing nothing, so, here’s a new online tool to join all the other online tools which allow you to lookup a MAC address for its relevant IEEE OUI vedor match.
Lots of other sites offer this (macvendors.com, oui.is, etc), but I often want to drop in a large list of MAC’s and have the output available as a CSV export. The only site I’ve which comes close to this is the venerable Wintelguy, however this site doesn’t have a nice CSV export button, so I decided to say ‘to hell with it, Internet, I’ll do it myself‘. And, Voila!
The Index page is a simple single MAC lookup tool, which automatically returns a match within a few characters of the MAC being input –
The bulk lookup tool allows for (up to) 500 MAC addresses to be looked up at once, and offers a CSV export once the search is complete.
I run a mail service for a number of friends, mainly personal, but some business. Part of the service configuration blocks attachments which are sent where the file is a specific extension (for example exe, com, bat, scr, vbs, etc). Over the last few years, it’s done a great job in filtering out malicious stuff, but of late, I’ve started pushing the files into an Open Source sandbox called Cuckoo, for extra protection, but also the nerd factor as this sort of thing interests me, Sandboxes are great, as they allow you to execute an unknown file in a restricted environment, then view the results without it ever affecting your actual computer. Once you have the results, you can decide whether it’s safe or not. So what follows should be considered a warning – ‘Don’t open THAT attachment!’.
First off, here’s the mail alert –
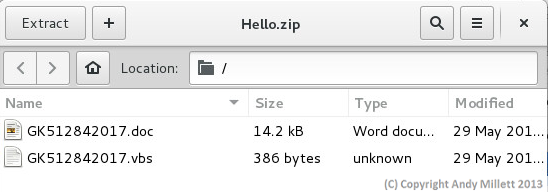
It actually looks like it’s come from a valid source, but if you look closer, you’ll see then the actual sender is IP 192.3.10.7 (owned by Colo-Crossing). Hmmmm….never-mind, we’ll push forward and take a peak at the file anyway. The actual file attachment in the mail is called ‘Hello.zip’, inside it are two files; a Word file, and a VBS script.
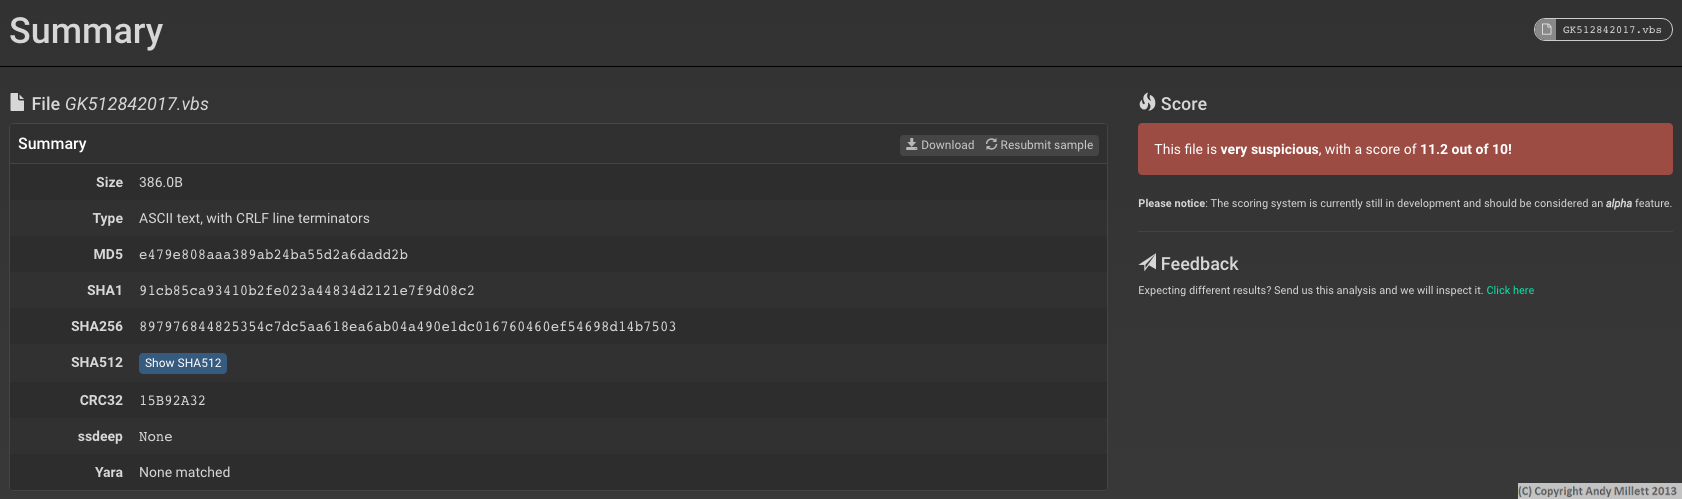
Files which are blocked are stored in a special mailbox for me to review. These files are uploaded to the Cuckoo Sandbox using a browser (no, I don’t use Windows to do this!) which is protected from running unknown scripts. Once the file is loaded, the sandbox executes it. I’ve ignored the Word file in the attachment, and instead gone straight to the VBS script. After a few minutes, the results are in –
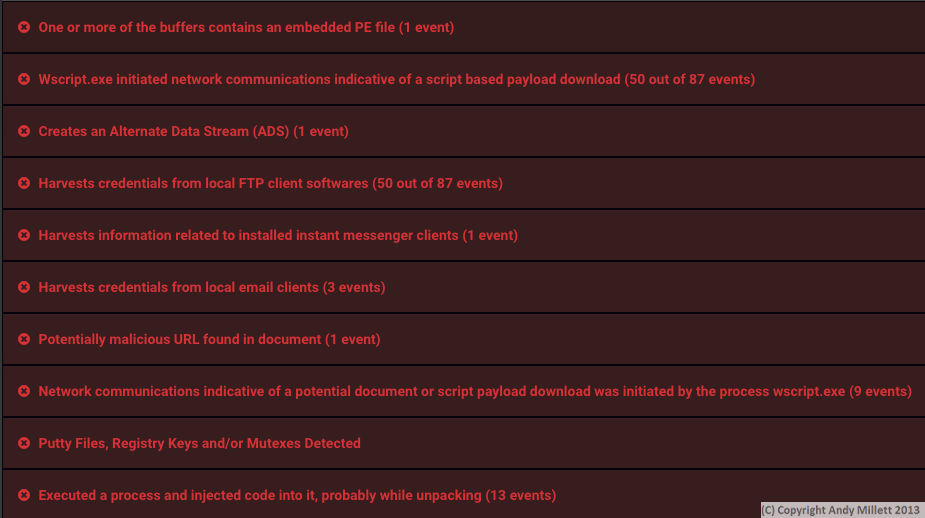
Uh oh, a score of 11.2 out of 10 (I guess it does say the score feature is in Alpha on Cuckoo :P), I’m already suspicious. Lets see what this VBS script does.
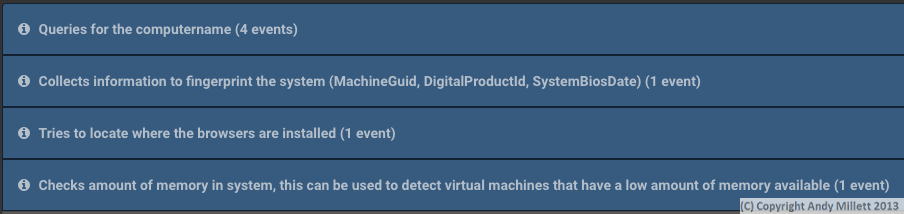
First off, it’s queried the computer name, asked about system information, queried which browsers are installed, and checked how much memory is available.
Thats suspicious, but not actually ‘doing’ anything to the system.
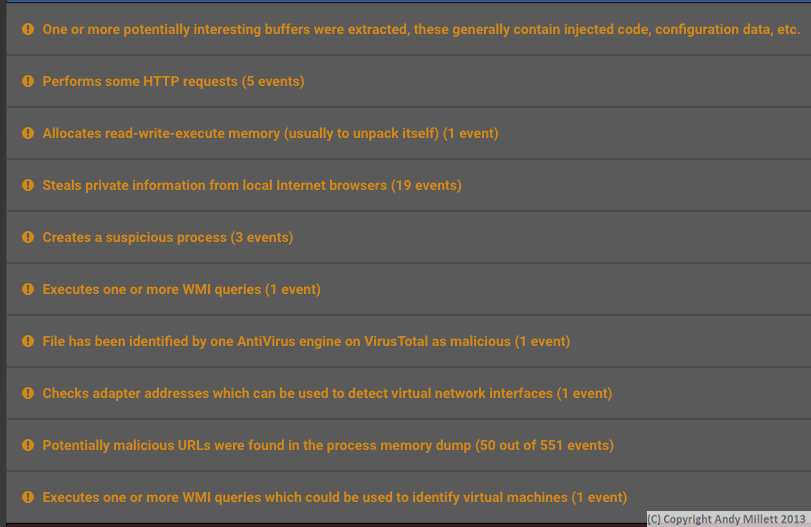
Next, we see the script starting to do something.
Whoa!! Now we’re getting somewhere. There’s quite a lot of things happening here, but the one which springs out to me more than any other is ‘File has been identified by one AntiVirus engine on VirusTotal’. VirusTotal, can check up to 56 AntiVirus engines, so being detected by only ONE is a serious issue. Think your local AV is going to protect you? Think again. Local AV is the last, and often worst line of defence. The script also initiates a number of outbound HTTP requests, and steals a lot of information from local browsers, as well as creating additional processes. Very scary!.
Finally, we see the real damage of the VBS script.
The VBS script now starts to do some credential stealing. Email, FTP, IM Client credentials amongst other nefarious actions, are raked from the machine. Add these to the fact it’s created a new process which is running on the computer (and will run at system startup), the computer is now something to run away from. All from opening an attachment from an unknown source.
Don’t open attachments from emails when you don’t recognise the source!
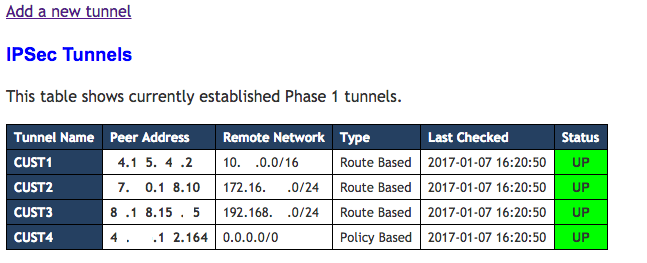
Juniper SRX has a great subset of SNMP Mibs for monitoring the device remotely. One of these is JUNIPER-IPSEC-FLOW-MON-MIB, which provides feedback on IKE Phase 1 and IPSec Phase 2 configured tunnels on the SRX. This saves having to login to the SRX to check the state of tunnels, and presents a nice Juniper SRX VPN monitor.
The end-result is below.
IKE Phase 1 Tunnel State
There’s a script (updatedpeers.php) which pulls the currently working Phase 1 IKE associations from the SRX every 5 minutes using a cron script.
This will update the MySQL database tables with the parsed output of OID (jnxIkeTunMonState, 1.3.6.1.4.1.2636.3.52.1.1.2.1.6). I did try using the jnxIpSecSaMonState OID, but unfortunately, this proved very unreliable for some reason, so instead I used the IKE (Phase 1) state which is both reliable, and should be there for a healthy security association anyway.
The data from the MySQL tables is pulled using another PHP file (status.php), and displayed on the page, which refreshes every 60 seconds.
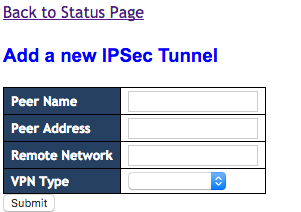
If you need to add more remote peers for monitoring, this is possible via an additional PHP file (add_tunnel.php)
Add new IPsec Tunnel
The PHP file, blank MySQL Tables and a short README file are available for download below –
juniperike – SHA256 sum – 26d9a294611b76eda7958982d17cbfe2ca14e0696fa2abfe108e460f6671d9ab
We use a similar page I wrote at the company I work for which monitors the tunnels on multiple customer SRX firewalls.
Over recent days, my mail relay has been receiving repeated email spam/malicious attachments to various accounts where the ‘from’ address claims to be ‘accounts@cdsgroup.co.uk’. CDS Group is a Courier Business operating in the UK. The emails contain zip files, and in-turn, the zip file contains a malicious xls.scr file which can cause nastiness on your PC. More information on CDS Group Email can be seen on the excellent Dynamoo Blog.
Here, from my mail logs is one such attempt.
Banned name: .exe,invoice_cdsgroup_799543.xls/invoice_cdsgroup_799543.xls.scr
Content type: Banned
Internal reference code for the message is 22915-03/KkviimjUhz4l
First upstream SMTP client IP address: [202.43.74.182]
According to a 'Received:' trace, the message apparently originated at:
 [202.43.74.182], [202.43.74.182] unknown [202.43.74.182]
Return-Path: <accounts@cdsgroup.co.uk>
From: "Kris Haley CDS Group" <accounts@cdsgroup.co.uk>
Message-ID: <20140807180922.A9A8119A8F8E354F@cdsgroup.co.uk>
Subject: CDS Invoice: 412-96221
The message has been quarantined as: banned@unimatrixzero.co.uk
CDS Group as far as I can tell don’t operate in Indonesia which is where the originating IP is from –
inetnum:        202.43.72.0 - 202.43.75.255
netname:        INTERLINK-TECH-ID
descr:          PT. INTERLINK TECHNOLOGY
descr:          Internet Service Provider
descr:          Cyber Data Centre 5th Floor
descr:          Cyber Building.
descr:          Jl. Kuningan Barat no. 8
descr:          Jakarta Selatan, 12710
country:        ID
So, CDS Group are completely innocent in this case, and I feel sorry for them. It’s a trivial matter to fake the ‘from’ address on an email, anyone can do it. Fortunately, they’ve now deleted the ‘accounts’ email alias on their domain, so anything claiming to be from that address is invalid.
It’s also a trivial matter to block emails claiming to be from ‘accounts@cdsgroup.co.uk’. I use Postfix as my mail relay software, and have added the following line to a ‘sender_access’ DB file which blocks email matching certain conditions.
accounts@cdsgroup.co.uk REJECT May your shit come to life and kiss you
As the SMTP 550 response says ‘May your shit come to life and kiss you’ (quoting the awesomeness of Frank Zappa).
Fun going down today on the web. My webserver is being hit by multiple IP attempts to POST data to xmlrpc.php which comes as part of the WordPress installation and is used for PingBack Vulnerability exploits to DDoS other WordPress sites. Thousands of individual IP addresses are attempting to ‘POST /xmlrpc.php HTTP/1.1’.
It’s been happening since around 0400 this morning (GMT).
A quick shell script to gather data from the access log shows 3741 unique IP addresses (and counting) attempting to send the following command to the webserver.
I’m doing a count of the access log file after searching for the relevant line on line 3 of the script, and the same command (except exporting the output to a text file) on line 4 of the script. The line 4 command is for some forensic investigations later although it’s possible/likely a lot of the IP addresses attempting to connect are members (un-whitingly) of a Botnet. The ipsort command from JimSun’s website helps to filter and show unique IP addresses.
Nothing has managed to get in so far, fortunately.
The POST request contains the following data –
POST /xmlrpc.php HTTP/1.1
Connection: Close
Content-Length: 215
Host: andymillett.co.uk
<?xml version="1.0" encoding="iso-8859-1"?>
<methodCall>
<methodName>wp.getUsersBlogs</methodName>
<params>
<param><value>test</value></param>
<param><value>427900</value></param>
</params>
</methodCall>
The <value></value> changes with every connecting IP, but everything else remains the same.
I’ve used open-source network flow monitoring software for a long time now. Sflow/Netflow/JFlow applications are a nice way of getting visibility of network throughput at ingress/egress points of your network, as are SPAN/TAP devices which simply listen on a mirror port. NTOP has been around for some years, is a great application for doing this and has recently under gone a lot of development to bring us NTOPNG. It also offers a low-cost alternative to full Layer 7 inspection devices although it doesn’t necessarily have the full detection depth of such commercial products (appliances such as Allot’s NetEnforcer, or Blue Coat’s Packetshaper).
NTOPNG is available as a source package which you can build yourself as well as pre-built binaries (some Linux OSes come with it packaged) all the way up to commercial appliances capable of monitoring flows at very high speeds. For my purposes, I used the source package, with the intention of building a Virtual Machine capable of monitoring the network and have a mirror port on my switch.
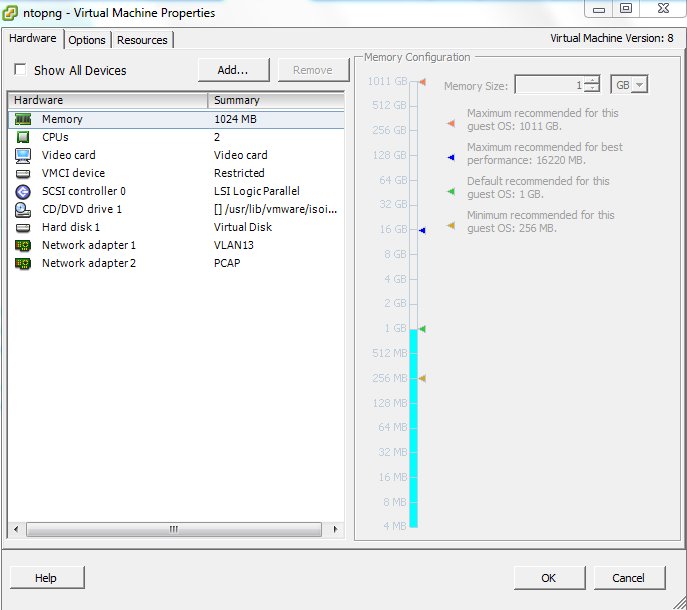
My VM settings are pretty basic – 1GB memory, 20GB disk space, and two vNIC’s. I used Debian as my OS of choice for the VM. A basic install was needed to begin with, with a few extra packages needed later to support the installation of NTOPNG (more on that below).
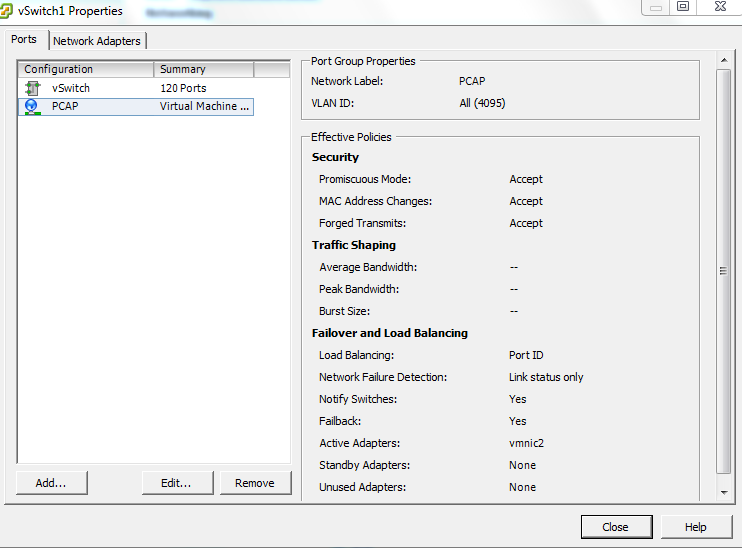
Network adapter 1 is for management, adapter 2 is for packet capturing from the switch mirror port. The mirror port uses a spare physical NIC on the ESX host which is configured in promiscuous mode (e.g it hears everything).
I won’t go into the basic install of Debian here, however, to build ntopng, you will need the following additional packages from the Debian APT sources repository –
When the above packages have been installed, you can that move forward with the NTOPNG installation.
First, download the two packages from the NTOP website. The files are (at time of writing) –
ntopng-1.1_6932.tgz – NTOPNG main source package
ntopng-data-1.1_6932.tgz – NTOPNG GEOIP data.
Place the files somewhere accessible on your VM (I use the /root directory). You’ll need to untar the ‘ntopng-1.1_6932.tgz’ file in the normal manner (e.g ‘tar xzvf ntopng-1.1_6932.tgz’). Once extracted, cd into the newly created ntopng directory
cd ntopng-1.1_6932
Now start building the package by entering the following command
./configure
If all is well and you have the necessary supporting packages installed (as mentioned above), the output after this command has executed should read –
You are now ready to compile typing make
Enter ‘make’ to start building ntopng. The VM will start to build ntopng and may take a few minutes depending on the speed of the CPU and how busy the ESX host is. When it is finished, you will simply be returned to a command prompt if the build was successful.
Next, enter the following command to install ntopng onto your Linux host.
make install
Once done, you can fire up ntopng. There are a number of parameters which can be specified with the ntopng command.
The above command actually runs from the /etc/rc.local file which is invoked at system startup. This means you don’t need to build a startup script for use in /etc/init.d/ with Debian, as rc.local is already called.
I found the login timeout for the web console annoyingly short, so disable logons (with the ‘-l’ switch) as ntopng is on a protected network segment.
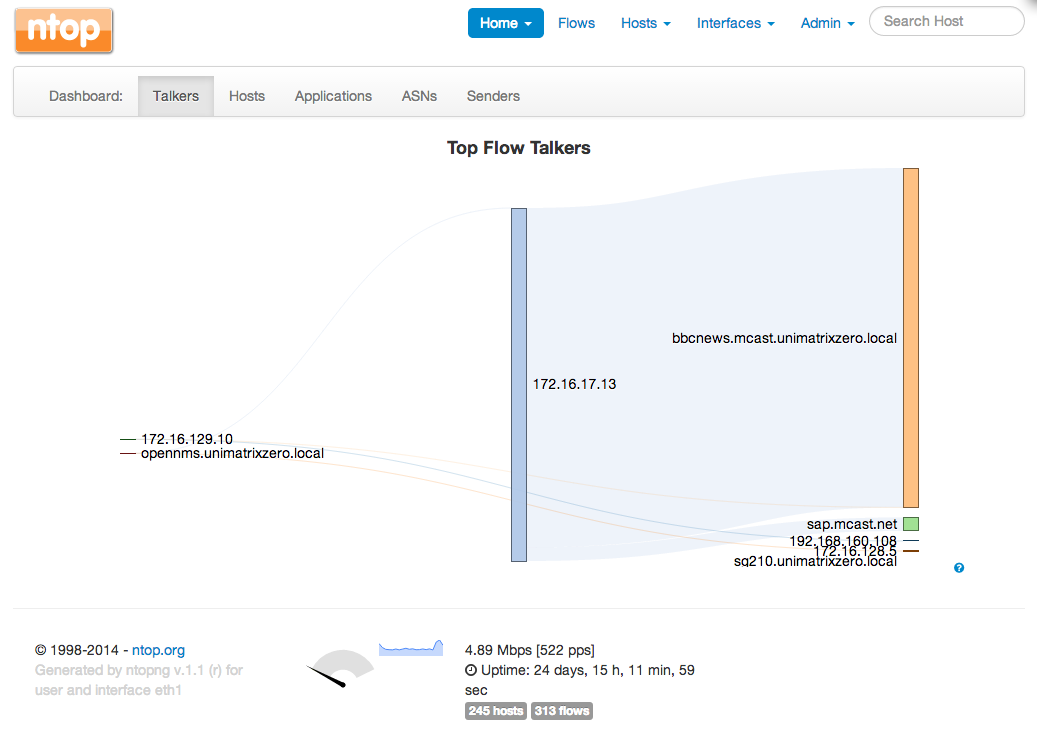
With all that done, here are some screen captures from ntopng. First off, live traffic.
Top Talkers
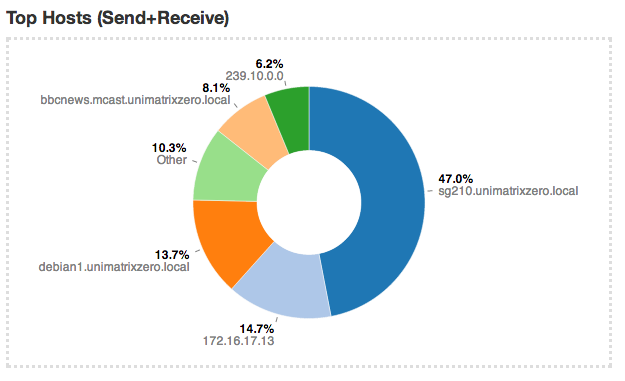
Top Hosts
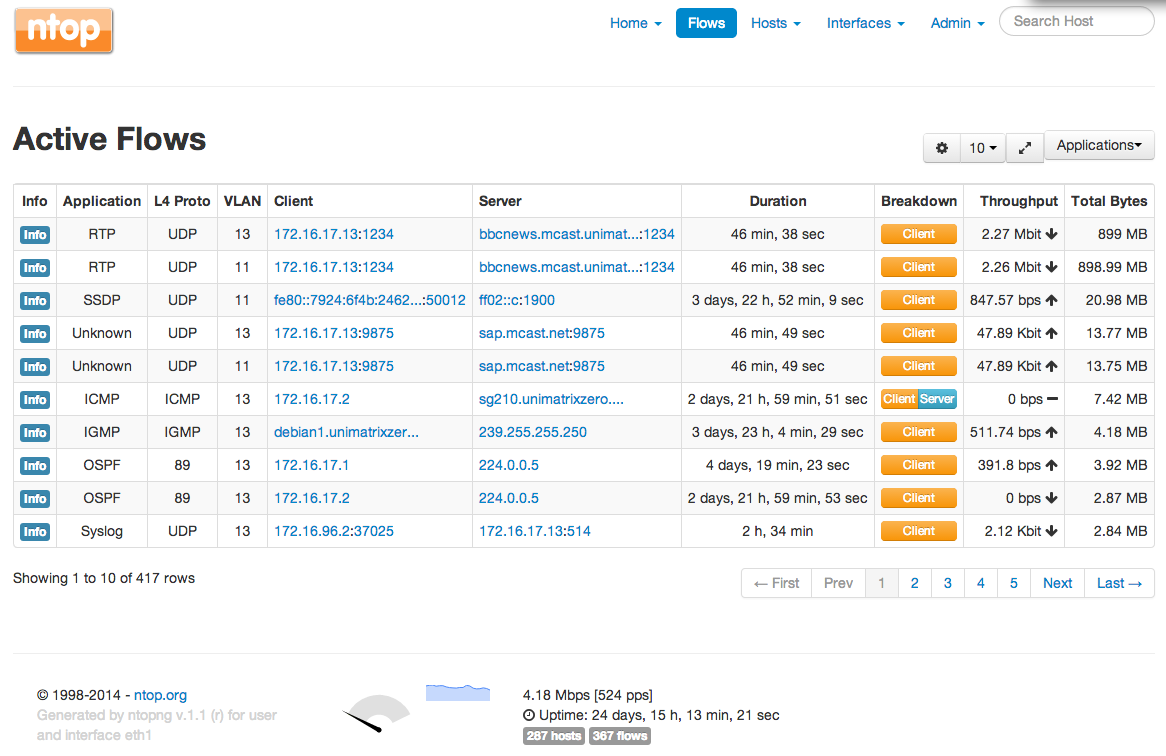
Active Flows
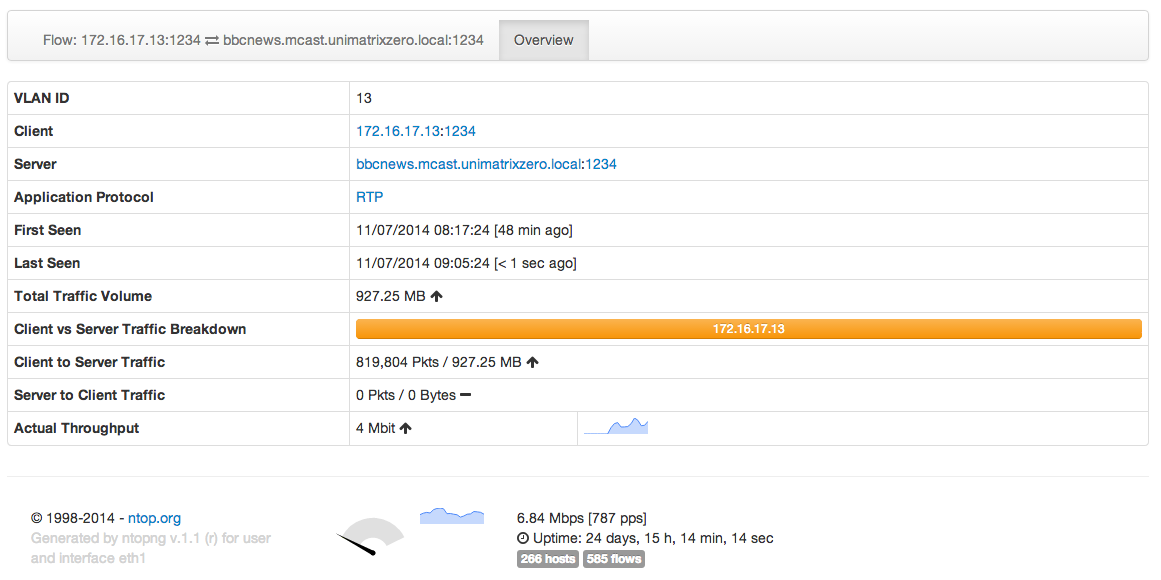
Flow Detail
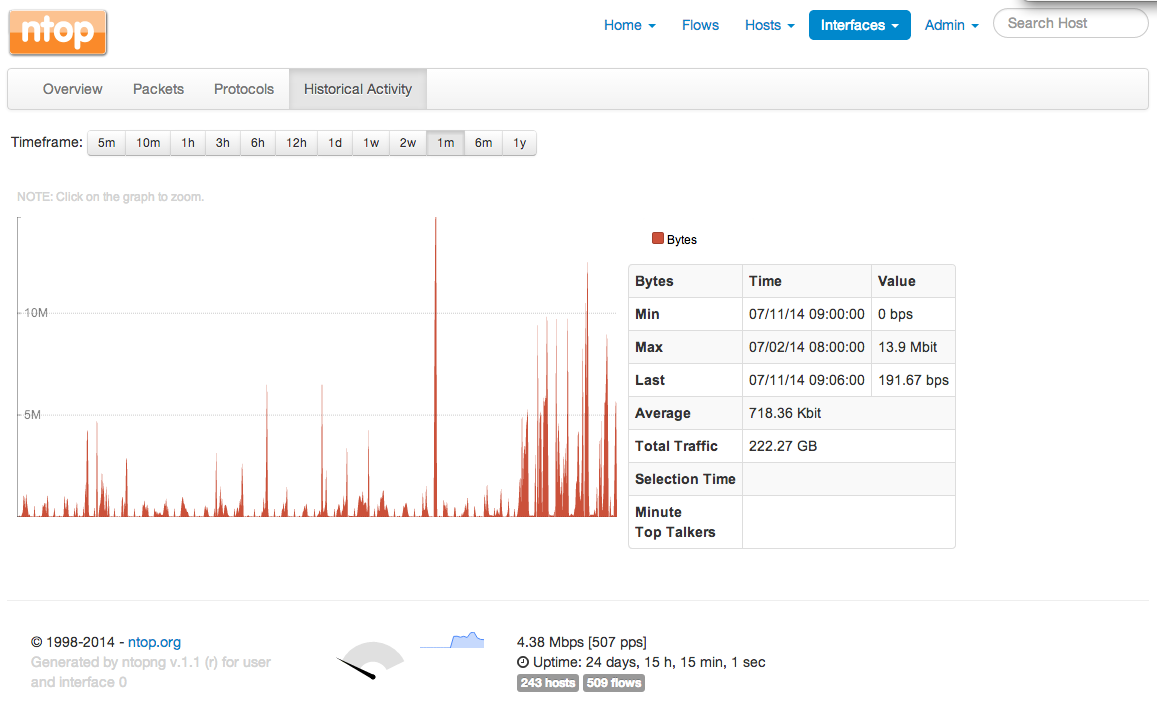
Next, we can view historical data from ntopng (this is based on information since the process started up).
Interface History
Protocol History
SPAN/TAP configuration
For the switch mirror end of the setup, I configured my Juniper EX2200C to mirror the ingress/egress port (ge-0/0/9) to the physical NIC which vSwitch1 is attached too (ge-0/0/10). This then maps the mirror port to the PCAP vNIC which is assigned to the Debian VM.
set ethernet-switching-options analyzer SESSION1 input ingress interface ge-0/0/9.0
set ethernet-switching-options analyzer SESSION1 input egress interface ge-0/0/9.0
set ethernet-switching-options analyzer SESSION1 output interface ge-0/0/10.0
set ethernet-switching-options storm-control interface all
Conclusion
So there you have it. NTOPNG setup and nicely monitoring my network. There are lots of other features to play with, including integration with block.si for URL Category monitoring which I may play with in the future.
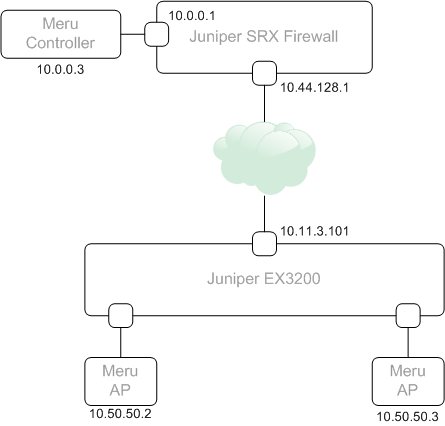
I recently had a need to establish a GRE tunnel between two sites. The reason being, we were deploying a Meru Wifi proof-of-concept where AP’s were on one site, and the controller on a remote site. Normally, the connectivity between AP’s the controller would go over the existing routed network (layer 3 mode in Meru-speak), but in this case, it wasn’t possible to get the new subnet assigned to the controller updated with the ISP providing the private links. As the customer was using Juniper EX switches and had a Juniper SRX firewall at the remote (controller) site, GRE allowed us to build the network without the need to involve the ISP.
The following topology was used –
GRE was added to the EX switch feature set in JunOS 12.1 (link here). In-order to use it, you need to allocate a physical port to be dedicated for tunnel services. For my example, I’ve used port ge-0/0/14 on the switch
set chassis fpc 0 pic 0 tunnel-port 14 tunnel-services
The JunOS 12.1 documentation above defines we allocate a port via it’s fpc and pic allocation. In my case, the switch was a single switch so the fpc was ‘0’. In a Virtual-Chassis environment, the fpc number would change. For example, if you wanted to use port 47 on switch 4, the command would be ‘set chassis fpc 4 pic 0 tunnel-port 47 tunnel-services’.
With the port allocated, we can then build the GRE configuration.
set interfaces gr-0/0/14 unit 0 tunnel source 10.11.3.101
set interfaces gr-0/0/14 unit 0 tunnel destination 10.44.128.1
set interfaces gr-0/0/14 unit 0 family inet address 10.11.12.1/24
On the SRX-side, the configuration is as follows.
set interfaces gr-0/0/0 unit 1 tunnel source 10.44.128.1
set interfaces gr-0/0/0 unit 1 tunnel destination 10.11.3.101
set interfaces gr-0/0/0 unit 1 family inet address 10.11.12.2/24
Each GRE interface has a tunnel source and destination set (this is the routed interface of the device at each end) and an inet address assigned to the interface which is used to establish the tunnel (10.11.12.1 and 10.11.12.2 in my case). I’ve used unit ‘1’ on my SRX, as I already have some GRE tunnels built to other destinations. A GRE interface uses the same unit assignment as a switch or inet port in JunOS, they can be used for different connection purposes.
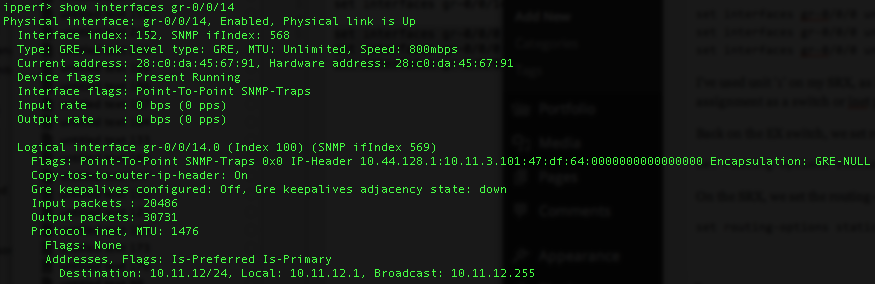
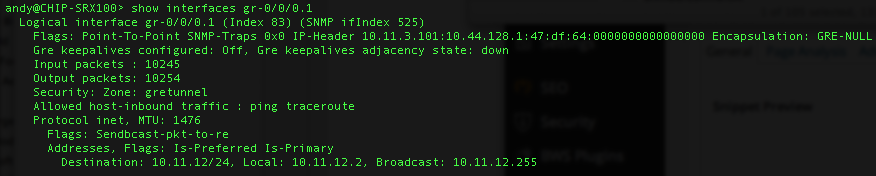
GRE tunnels show ‘UP’ immediately, even if the configuration isn’t set correctly, so don’t assume as it’s UP, it’s going to work. Look closely at the Input/Output packet count to validate traffic flow.
Here’s the output of ‘show interfaces gr-0/0/14.0’ on the EX.
Now the output of ‘show interfaces gr-0/0/0.1’ on the SRX.
Back on the EX switch, we set routing-options to send any 10.0.0.0/24 traffic through the GRE tunnel.
set routing-options static route 10.0.0.0/24 next-hop gr-0/0/14.0
On the SRX, we set the routing-options to send any 10.50.50.0/24 traffic in the same manner.
set routing-options static route 10.50.50.0/24 next-hop gr-0/0/0.1
As the SRX is a firewall, we need to perform some additional steps to allow traffic. This means creating a ‘zone’ to assign the GRE tunnel interface too, disabling any Network Address Translation rules, and some security policies to permit the traffic. Here’s what I’ve configured.
set security policies from-zone gretunnel to-zone trust policy allowall match source-address any
set security policies from-zone gretunnel to-zone trust policy allowall match destination-address any
set security policies from-zone gretunnel to-zone trust policy allowall match application any
set security policies from-zone gretunnel to-zone trust policy allowall then permit
set security policies from-zone trust to-zone gretunnel policy allowall match source-address any
set security policies from-zone trust to-zone gretunnel policy allowall match destination-address any
set security policies from-zone trust to-zone gretunnel policy allowall match application any
set security policies from-zone trust to-zone gretunnel policy allowall then permit
set security zones security-zone gretunnel host-inbound-traffic system-services ping
set security zones security-zone gretunnel host-inbound-traffic system-services traceroute
set security zones security-zone gretunnel interfaces gr-0/0/0.1
set security nat source rule-set trust-to-gre from zone trust
set security nat source rule-set trust-to-gre to zone gretunnel
set security nat source rule-set trust-to-gre rule source-nat-off match source-address 0.0.0.0/0
set security nat source rule-set trust-to-gre rule source-nat-off then source-nat off
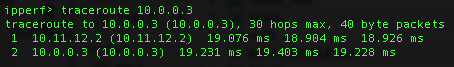
Now we should be able to initiate a traceroute from the EX switch to our Meru Controller (10.0.0.3).
Looks good. We enter the GRE tunnel interface (10.11.12.2) and exit directly to the Meru Controller.
Protecting your computer online is a minefield of choices for a user to contemplate; should you trust the software you install not to be riddled with backdoors, the websites you visit to make sure their code isn’t riddled with malicious scripts or linked to malicious third-party sites, the ISP who provides your connection to stop the bad guys before they get to your home connection, or a combination of all to make sure you don’t get hacked/compromised/infected, become hijacked and join a botnet or lose your private information?
For my day job, I often see company networks relatively well protected with Next Generation Firewalls which inspect protect corporate networks from attack using advanced IDS/IDP/Content Filtering/Application Inspection features, but these devices cost a lot of money. So how to add some much needed protection to your computer, for free?
If you checkout my other posts here, you’ll notice I’m a bit of a Blue Coat fan. I’ve worked with their products for 10 years and have always been mightily impressed with their capability of protecting corporate users from websites which want to install malicious code or steal information. As with the Next Generation Firewalls, those Blue Coat products cost money, however there’s one product Blue Coat provides which is designed with home users in-mind and is free; K9 Web Protection.
K9 is specifically designed to allow Parental Control of children’s internet browsing, restricting which website categories your child can visit, how much time they can spend online and whether Search Engine Safe Search is enabled. Whilst this is great, K9 can also provide highly effective protection for everyone’s computer whether you have children or not.
K9 uses Blue Coat’s ‘Web Pulse‘ collaborative online rating system. Web Pulse is a global network maintained by Blue Coat which provides an almost instant rating of categorised and uncategorised web pages using many different methods such as page content, links on the page to other websites, DNS information, hosting history (e.g is the server hosting the website also hosting content from a known malicious source) and historical reputation. It rates 1 Billion+ requests per-day from 75+ million users worldwide. The ‘collaborative’ part of this system is that all of the Blue Coat corporate devices (the ProxySG, ProxyAV and PacketShaper), and existing K9 users feed uncategorised URLs to Web Pulse for it to rate. The effect of this is that any URL one user sends to Web Pulse for categorisation, other users of Web Pulse get the benefit of that categorisation. Thats very cool, no?!
I won’t go into getting the software install, there are some very good instructions on the K9 website on how it’s done, instead I’ll show you what you need to do to protect yourself from the bad guys online.
First, login to the K9 Web Protection (usually in Program Files / Blue Coat for Windows or Applications / K9 Web Protection if you use a Mac), and navigate to the ‘Setup’ section.
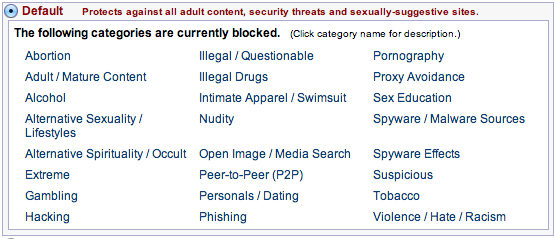
By default, when you install and activate K9, it blocks a number of categories out of the box.
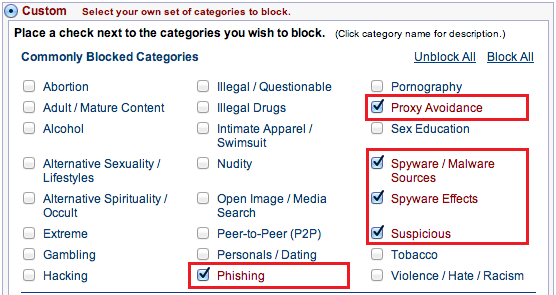
You may want to keep those as is, however if you want a less restrictive, but still protected level of categories, choose ‘Custom’ then check the following.
Make sure you click ‘Save’ at the bottom of the page to finish the changes.
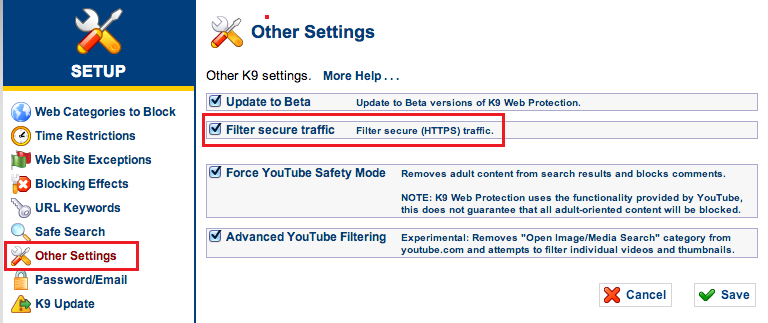
Finally, under ‘Other Settings’ (on the left), ensure that ‘Enable HTTPS Filtering’ is checked (this is the default).
Why enable HTTPS filtering? See below at the end of the document for more information.
A Real Life Use Case
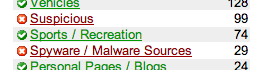
As an example of how K9 can protect users online, lets take my wife’s internet browsing habits. She’s what I’d class as a ‘regular’ internet user, browsing shopping sites, checking her email, and watching TV online. My wife is a Filipino, so likes to keep up-to-date with programs from the Philippines. There are a few places online which allow this, but she primarily uses just one. That site is packed with advertisements, popups, and links to other external sites as I guess they have to pay for it some how, however, here’s a snapshot of the K9 Web Protection report from her Macbook.
So, as a ‘regular’ internet user, with no intention of visiting a site which is malicious, she’s visited something which is clearly classified as Suspicious or Spyware/Malware Source according to K9!
Why HTTPS?
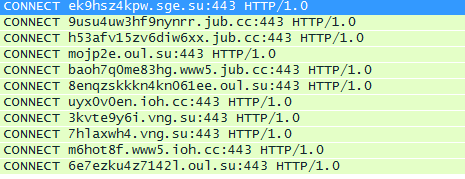
I mentioned above that you should ensure ‘Enable HTTPS Filtering’ is enabled in K9; the reason why is that malicious content is more and more often distributed over HTTPS. I recently came across some clients which were attempting to do just this when inspecting a Blue Coat ProxySG appliance. The following domains were those which clients were attempting to connect too –
Those domain name look suspicious straight off, no? Here’s a screen capture of those connection attempts. In this case, the client computer is attempting to make a HTTPS ‘CONNECT’ to the sites listed above. ‘CONNECT’ is the method used by HTTPS communication to setup the session between your client and the server on the internet.
In this case, as the customer was protected by a ProxySG appliance, the requests were blocked, however it is a good demonstration of why HTTPS, as well as HTTP should be inspected if you use K9.
So there it is, protect your computer (or Mac) online, for free. Install it now, before its to late!
DHCP IP Addresses with Blue Coat ThreatPulse/Juniper SRX
A problem landed on my desk the other day from a customer in relation to using the excellent Blue Coat ThreatPulse cloud SaaS product when the Juniper SRX sits behind a DHCP assigned public IP Address. Worse, due to the location of some sites and the ISP offering available, the SRX was itself behind a home broadband NAT router doing IPSec pass-through in order to establish a connection back to the corporate network.
ThreatPulse is Blue Coat’s SaaS which has been around for a couple of years and leverages the use of their existing Web Pulse(TM) dynamic rating system to categorise unknown URL’s on-the-fly or return previous categorisation. With Data POD’s located strategically around the world, it’s possible to control web access for HQ, home or roaming workers in a single place using one of several methods –
Explicit Proxy – Configuring client browsers to use ThreatPulse directly
IPSec Forwarding – Configuring an edge firewall to transparently intercept requests and send them to ThreatPulse using a LAN-to-LAN tunnel
Proxy Forwarding – Utilising an on-site proxy to forward requests to ThreatPulse.
Client Connector – A software package which sits on a client machine (Laptop/Mac) which transparently intercepts requests and sends them to ThreatPulse
Mobility Connector – An iOS client which creates a VPN tunnel to ThreatPulse to control what apps and browsers can do on iDevices.
This particular problem, and the solution I came up with relates to the first three connection methods, Explicit Proxy, IPSec Forwarding and Proxy-Forwarding. Each of these methods requires that you setup a ‘Location’ within the ThreatPulse dashboard.
ThreatPulse Locations
Selecting the IPSec (Firewall/VPN) location brings up its configuration section.
ThreatPulse Location Edit
As you can see, there’s no place to update this dynamically, and ThreatPulse doesn’t support Aggressive mode VPN which can sometimes help to mitigate such problems. In this case, however, we have to do something at the SRX end.
There’s some useful information on Blue Coat’s Knowledge Base for making changes to ThreatPulse using the built-in API. The API is designed for situations like this where administrators need an automated way of updating ThreatPulse, but without having to login to the administration dashboard. Unfortunately, the documentation doesn’t specifically cover Juniper SRX (or SSG for that matter), it covers Cisco IOS and using ‘ip ddns’ commands to update the ThreatPulse service settings. All that said, the API can be used in-conjunction with the SRX and what follows is how I did it.
In some of my previous posts I’ve used the underlying BSD cli to update things like Firewall Filters. Using this method again, we can update ThreatPulse Location settings without having to login.
When in the shell of JunOS, there are several useful commands available – CP, CuRL, Diff, and Cat. These are used in the following script –
#!/bin/sh
cp ipnow.txt ipprev.txt
curl http://andymillett.co.uk/rip.php > ipnow.txt
IPN=`cat ipnow.txt`
if diff ipnow.txt ipprev.txt >/dev/null ; then
else
 curl "http://<user>:<password>@portal.threatpulse.com:8080/api/locations?name=<location>&type=<type>&ip=<NEWIPADDRESS>&key=<PRE-SHARED-KEY>"
fi
Basically, the script copies the last IP Address check results from ‘ipnow.txt’ to ‘ipprev.txt’, uses CuRL to get the Public IP Address at the time the script is run, and copies the output to a new ‘ipnow.txt’ file after which it performs a ‘diff’ against the two files within an ‘if’ statement. If the ‘if’ statement evaluates that the two files are the same, it does nothing, however if it evaluates that there is a difference, it performs a ‘cat’ against the new ‘ipnow.txt’ file and uses it as part of the new CuRL string sent to ThreatPulse API which updates the location.
The other end of this is a simple PHP page which returns the IP Address in text form.
All it needs is to be on a public Web Server somewhere the SRX can get too.
With both ends in place (the script on the SRX, and the PHP script on the Web Server), you can run the script manually if you like by running – ‘sh <script_name>’.
To test that the script would work properly, I setup two additional scripts on the SRX in our Lab. Both simply do a ‘load replace’ from a pre-defined file (script 1/2 data below) –
interfaces {
replace:
fe-0/0/7 {
 unit 0 {
 family inet {
 address 94.17.248.16/27;
 }
 }
}
Following this, three cron entries were required to kick things off
*/5 * * * * (cd /cf/var/home/cronadmin; sh checkip.sh)
5 1,3,5,7,9,11,13,15,17,19,21,23 * * * (cd /cf/var/home/cronadmin; sh uif15.sh)
5 2,4,6,8,10,12,14,16,18,20,22 * * * (cd /cf/var/home/cronadmin; sh uif16.sh)
Line 1 executes my script to check the external IP address.
Line 2 executes the change IP ‘load replace’ script at odd hours.
Line 3 executes the change IP ‘load replace’ script at even hours.
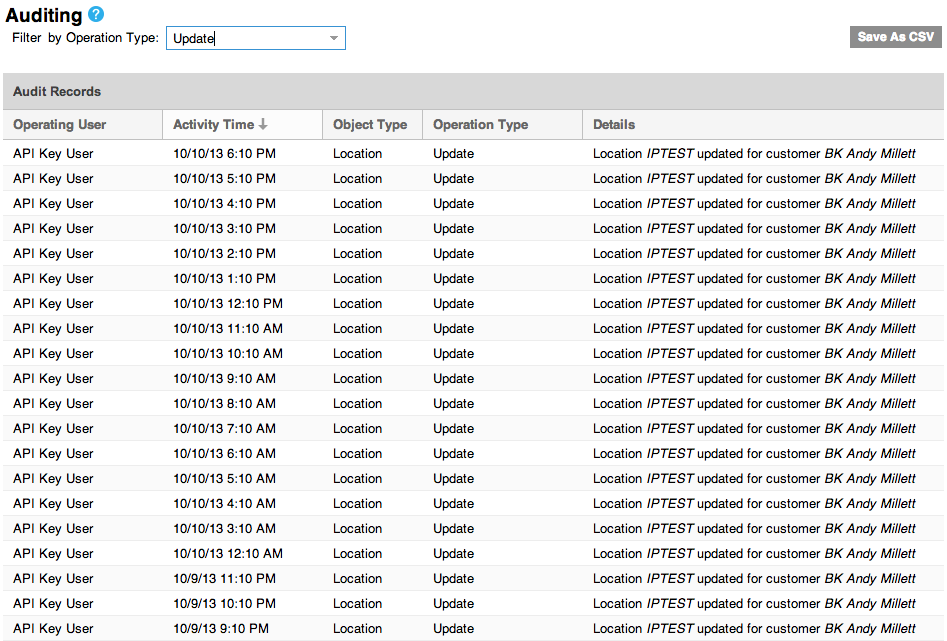
Having left this running for a week, the results are pretty good (below is from my ThreatPulse account under the Services / Account Maintenance section which gives a full audit of what has been happening under the account) –
Sweet! Simple Unix commands and a cron script save the day!
Unfortunately, I don’t have a DSL connection which I can put an SRX onto behind a NAT router, however this script will work irrespective of this (e.g it will pickup the public IP of the NAT router).
The above script is for IPSec Forwarding (Firewall/VPN in ThreatPulse speak), however the script above will work in just the same way if you choose to use the Proxy-Forwarding or Explicit Proxy method. For example –
Now, you might perhaps notice that the above examples use HTTPS, whereas my script uses HTTP over port 8080. Weeeeeeell, unfortunately, when Juniper compiled JunOS and it’s associated libraries, the didn’t include HTTPS in ‘libcurl’ which leads to the following error if you attempt to use HTTPS –
curl: (1) Protocol https not supported or disabled in libcurl
This, despite the fact that the options are available under ‘–help’. For example –
-1/--tlsv1 Use TLSv1 (SSL)
-2/--sslv2 Use SSLv2 (SSL)
-3/--sslv3 Use SSLv3 (SSL)
That strikes me as a bit shoddy, but we have to work with what we get. Perhaps Juniper will fix it in later releases.
So there it is, if you have purchased Blue Coats excellent ThreatPulse SaaS (and, oh boy should you) and you have an SRX which is sat on a DHCP assigned IP address somewhere on your network, the above will help you keep ThreatPulse updated with any changes in the IP.