NTOPNG Network Flow Monitoring
I’ve used open-source network flow monitoring software for a long time now. Sflow/Netflow/JFlow applications are a nice way of getting visibility of network throughput at ingress/egress points of your network, as are SPAN/TAP devices which simply listen on a mirror port. NTOP has been around for some years, is a great application for doing this and has recently under gone a lot of development to bring us NTOPNG. It also offers a low-cost alternative to full Layer 7 inspection devices although it doesn’t necessarily have the full detection depth of such commercial products (appliances such as Allot’s NetEnforcer, or Blue Coat’s Packetshaper).
NTOPNG is available as a source package which you can build yourself as well as pre-built binaries (some Linux OSes come with it packaged) all the way up to commercial appliances capable of monitoring flows at very high speeds. For my purposes, I used the source package, with the intention of building a Virtual Machine capable of monitoring the network and have a mirror port on my switch.
My VM settings are pretty basic – 1GB memory, 20GB disk space, and two vNIC’s. I used Debian as my OS of choice for the VM. A basic install was needed to begin with, with a few extra packages needed later to support the installation of NTOPNG (more on that below).
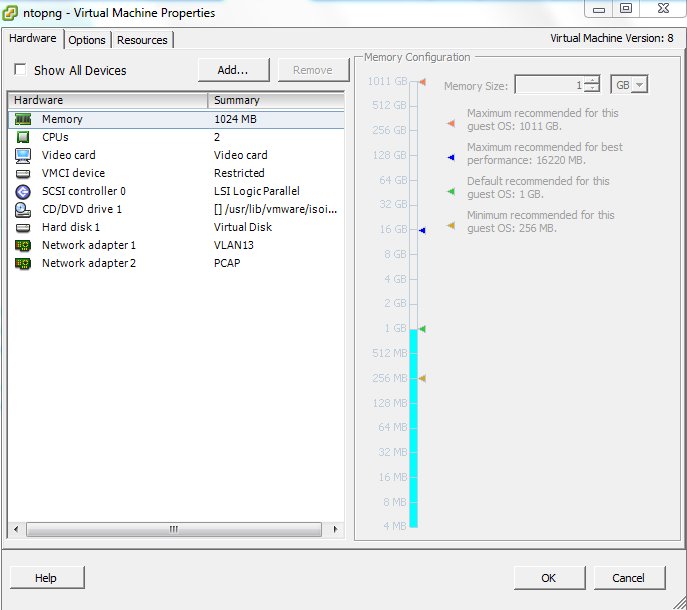
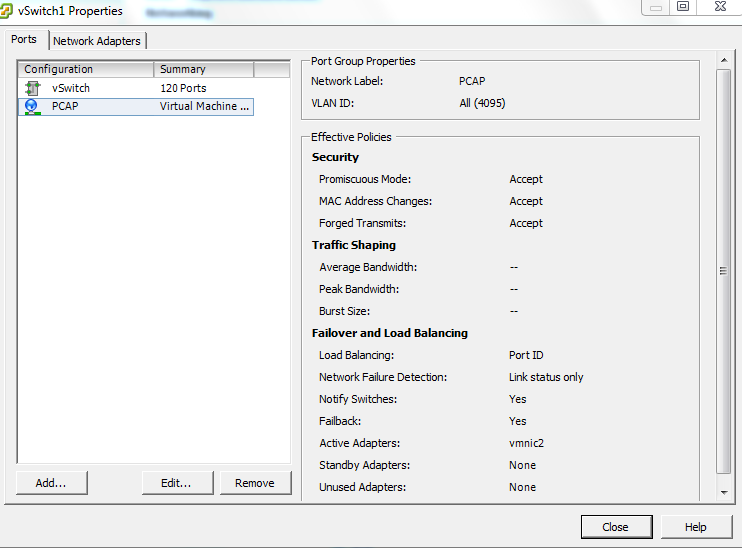
Network adapter 1 is for management, adapter 2 is for packet capturing from the switch mirror port. The mirror port uses a spare physical NIC on the ESX host which is configured in promiscuous mode (e.g it hears everything).
I won’t go into the basic install of Debian here, however, to build ntopng, you will need the following additional packages from the Debian APT sources repository –
apt-get install rrdtool libxml2 wget curl tcpdump libpcap-dev linux-headers-3.2.0-4-amd64 subversion libxml2-dev libglib2.0-0 libglib2.0-dev redis-server
When the above packages have been installed, you can that move forward with the NTOPNG installation.
First, download the two packages from the NTOP website. The files are (at time of writing) –
ntopng-1.1_6932.tgz – NTOPNG main source package
ntopng-data-1.1_6932.tgz – NTOPNG GEOIP data.
Place the files somewhere accessible on your VM (I use the /root directory). You’ll need to untar the ‘ntopng-1.1_6932.tgz’ file in the normal manner (e.g ‘tar xzvf ntopng-1.1_6932.tgz’). Once extracted, cd into the newly created ntopng directory
cd ntopng-1.1_6932
Now start building the package by entering the following command
./configure
If all is well and you have the necessary supporting packages installed (as mentioned above), the output after this command has executed should read –
You are now ready to compile typing make
Enter ‘make’ to start building ntopng. The VM will start to build ntopng and may take a few minutes depending on the speed of the CPU and how busy the ESX host is. When it is finished, you will simply be returned to a command prompt if the build was successful.
Next, enter the following command to install ntopng onto your Linux host.
make install
Once done, you can fire up ntopng. There are a number of parameters which can be specified with the ntopng command.
Usage:
 ntopng <configuration file>
 or
 ntopng [-m <local nets>] [-d <data dir>] [-e] [-g <core>] [-n mode] [-i <iface|pcap file>]
 [-w <http port>] [-p <protos>] [-P] [-d <path>]
 [-c <categorization key>] [-r <redis>]
 [-l] [-U <sys user>] [-s] [-v] [-C]
 [-B <filter>] [-A <mode>]
My command line is specified as follows –
/usr/local/bin/ntopng -i eth1 -m "172.16.17.0/28, 172.16.129.0/24, 172.16.100.0/24, 192.168.17.0/24, 10.23.1.0/24, 10.22.1.0/24. 10.21.1.0/24, 10.20.1.0/24, 172.16.96.0/24" -n 0 -e -l
The above command actually runs from the /etc/rc.local file which is invoked at system startup. This means you don’t need to build a startup script for use in /etc/init.d/ with Debian, as rc.local is already called.
I found the login timeout for the web console annoyingly short, so disable logons (with the ‘-l’ switch) as ntopng is on a protected network segment.
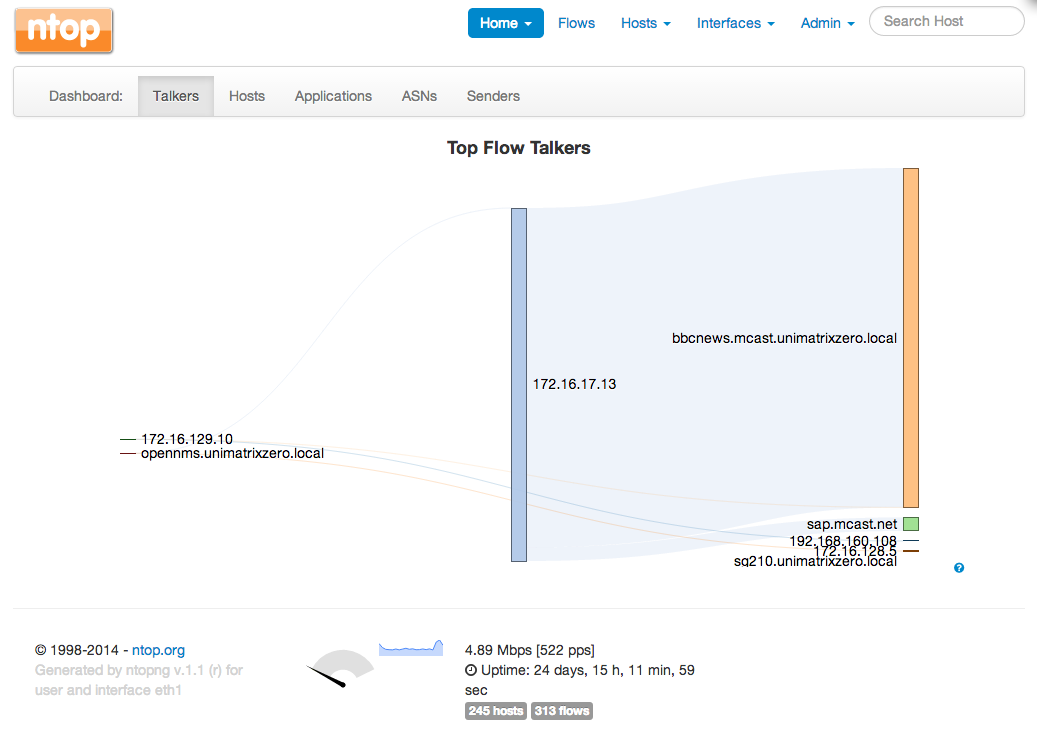
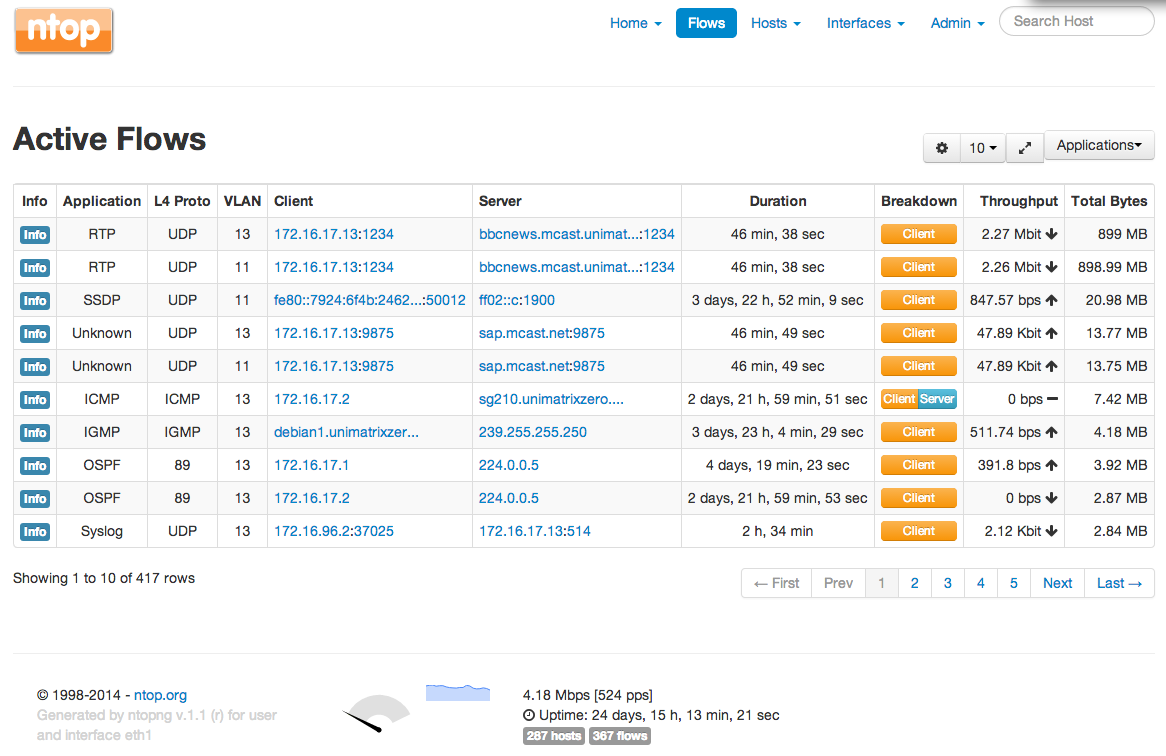
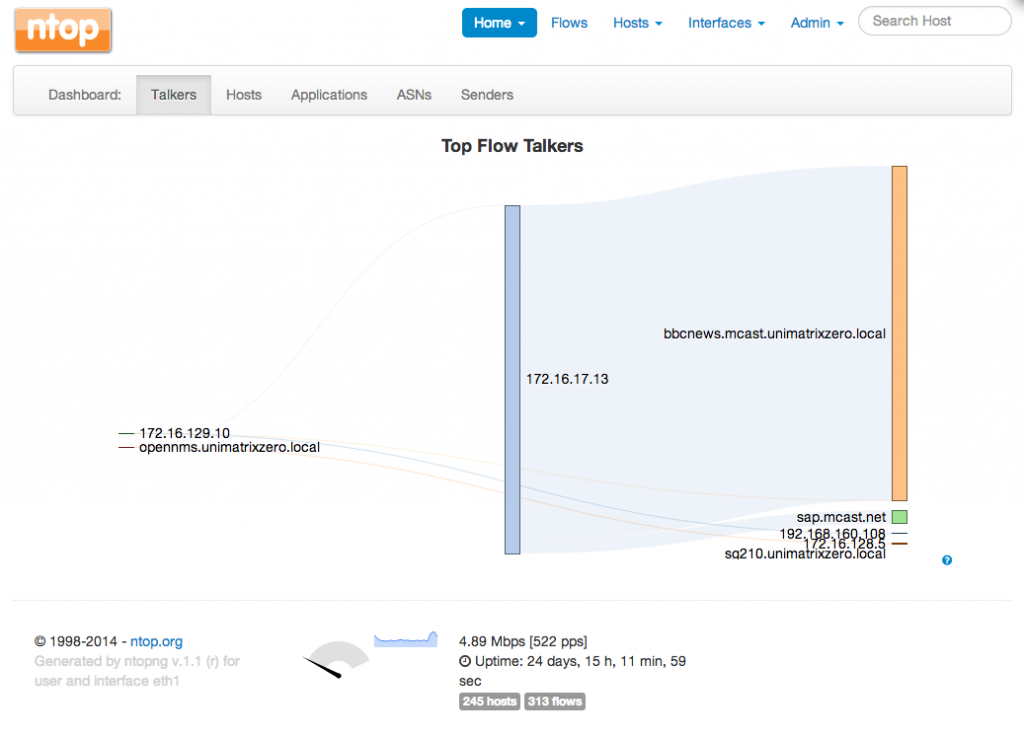
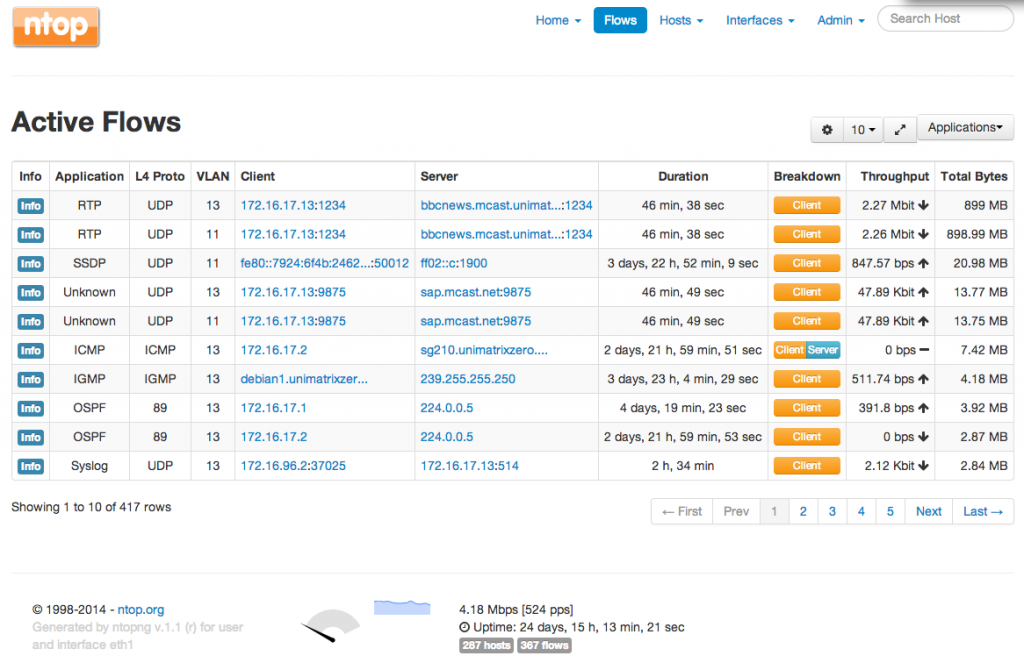
With all that done, here are some screen captures from ntopng. First off, live traffic.
Top Talkers
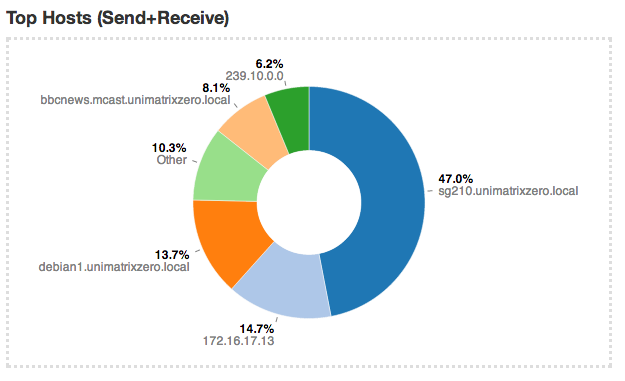
Top Hosts
Active Flows
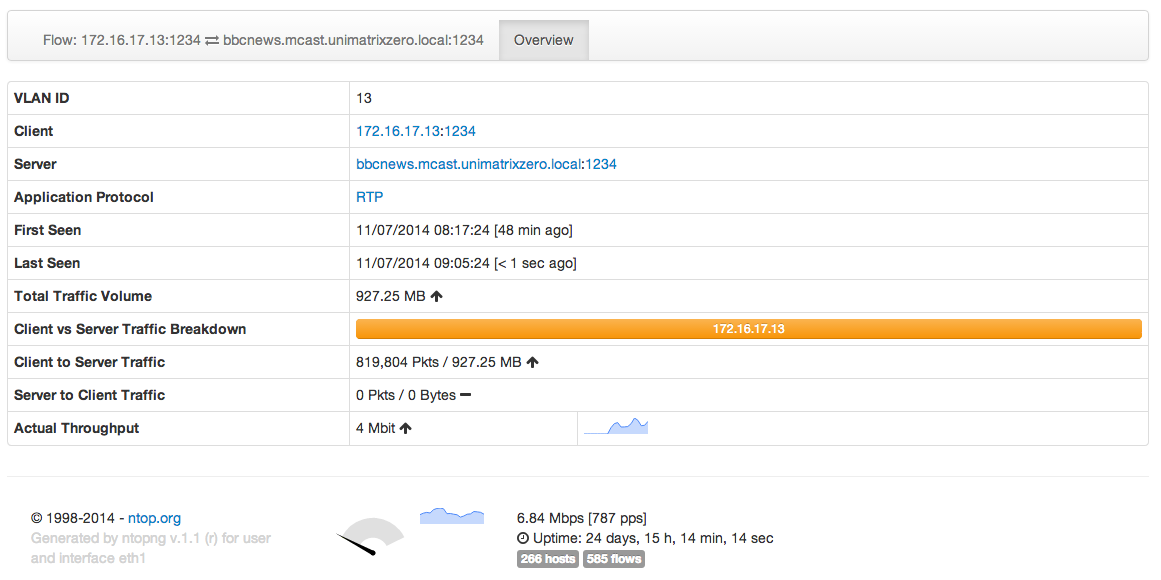
 Flow Detail

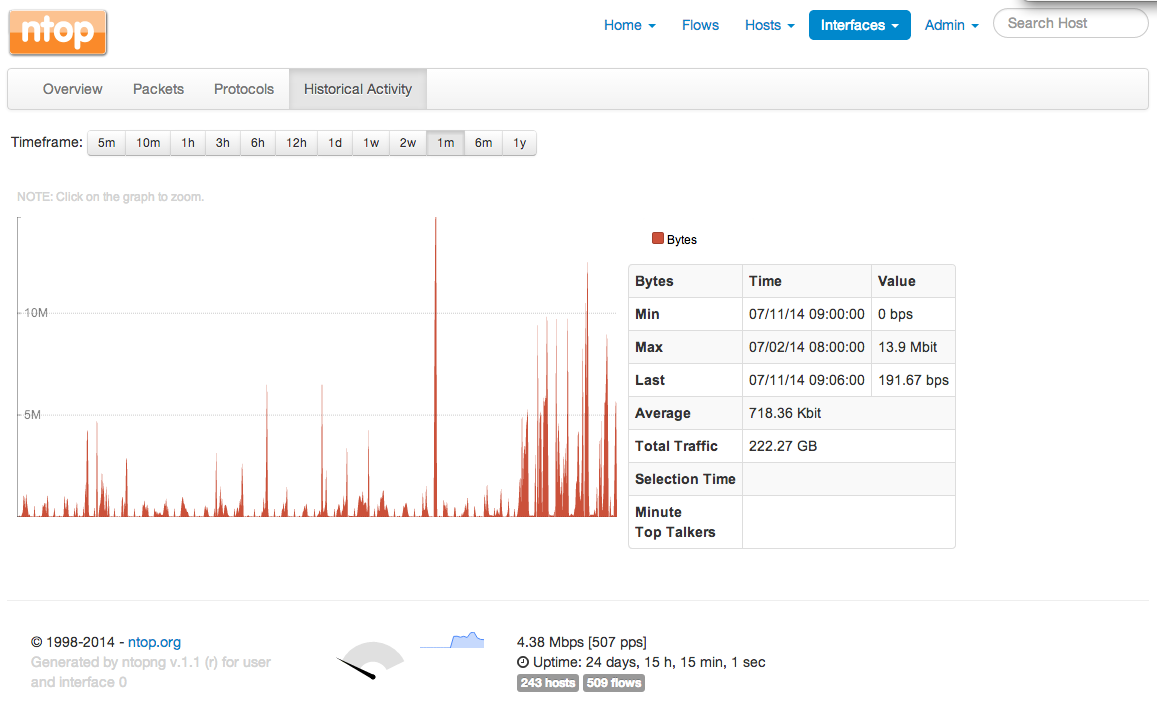
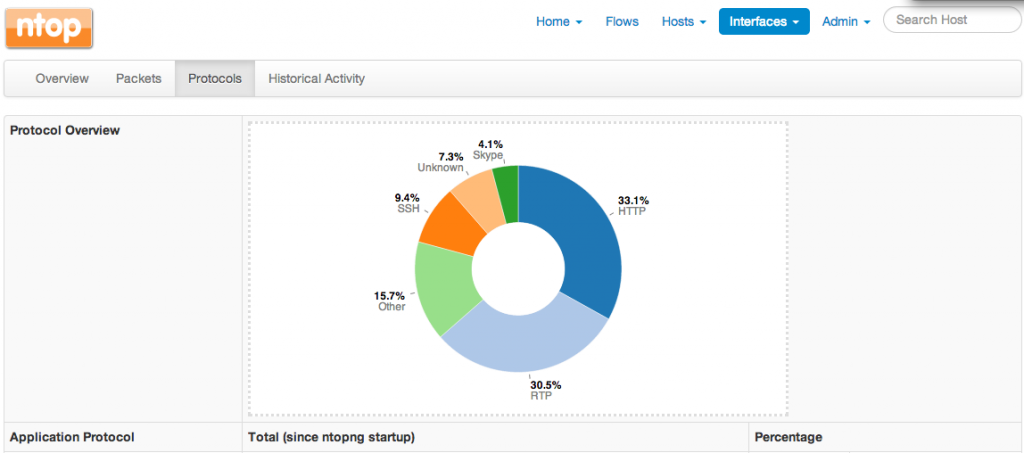
Next, we can view historical data from ntopng (this is based on information since the process started up).
Interface History

Protocol History
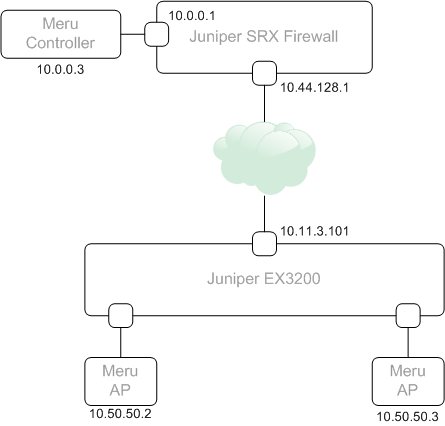
SPAN/TAP configuration
For the switch mirror end of the setup, I configured my Juniper EX2200C to mirror the ingress/egress port (ge-0/0/9) to the physical NIC which vSwitch1 is attached too (ge-0/0/10). This then maps the mirror port to the PCAP vNIC which is assigned to the Debian VM.
set ethernet-switching-options analyzer SESSION1 input ingress interface ge-0/0/9.0
set ethernet-switching-options analyzer SESSION1 input egress interface ge-0/0/9.0
set ethernet-switching-options analyzer SESSION1 output interface ge-0/0/10.0
set ethernet-switching-options storm-control interface all
Conclusion
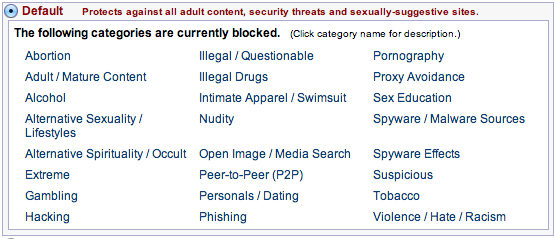
So there you have it. NTOPNG setup and nicely monitoring my network. There are lots of other features to play with, including integration with block.si for URL Category monitoring which I may play with in the future.